

Big Corporate Profits, Big Worries for Millions
Big Corporate Profits, Big Worries for Millions
Companies benefited from laying people off and selling existing inventory.

I’ve heard from some people that they couldn’t see something I had on Forbes because they came up against the new paywall, which is going to significantly cut their traffic, I think.
However, as the topic is important and I own the material, here’s the piece.

Corporate Profits Skyrocket While Millions Face Bad Times
There is a twisted social insanity that regularly bubbles up, but which currently roils. Forget for a moment the Dow’s shattering of the 30,000-point barrier (prompting a Fortune newsletter to posit “placing bets on Dow 40K”). Or, more telling, the S&P 500’s 3,626.22 yesterday—its highest level ever.
The real news comes from the U.S. Bureau of Economic Analysis (BEA), which released the first take on corporate profits in the third quarter of 2020.
Given the Q3 GDP rebound that brought that measure of the economy within about ten percentage points of where it was before the second quarter crash, one might expect corporate profits to begin coming back.
They did more than that.
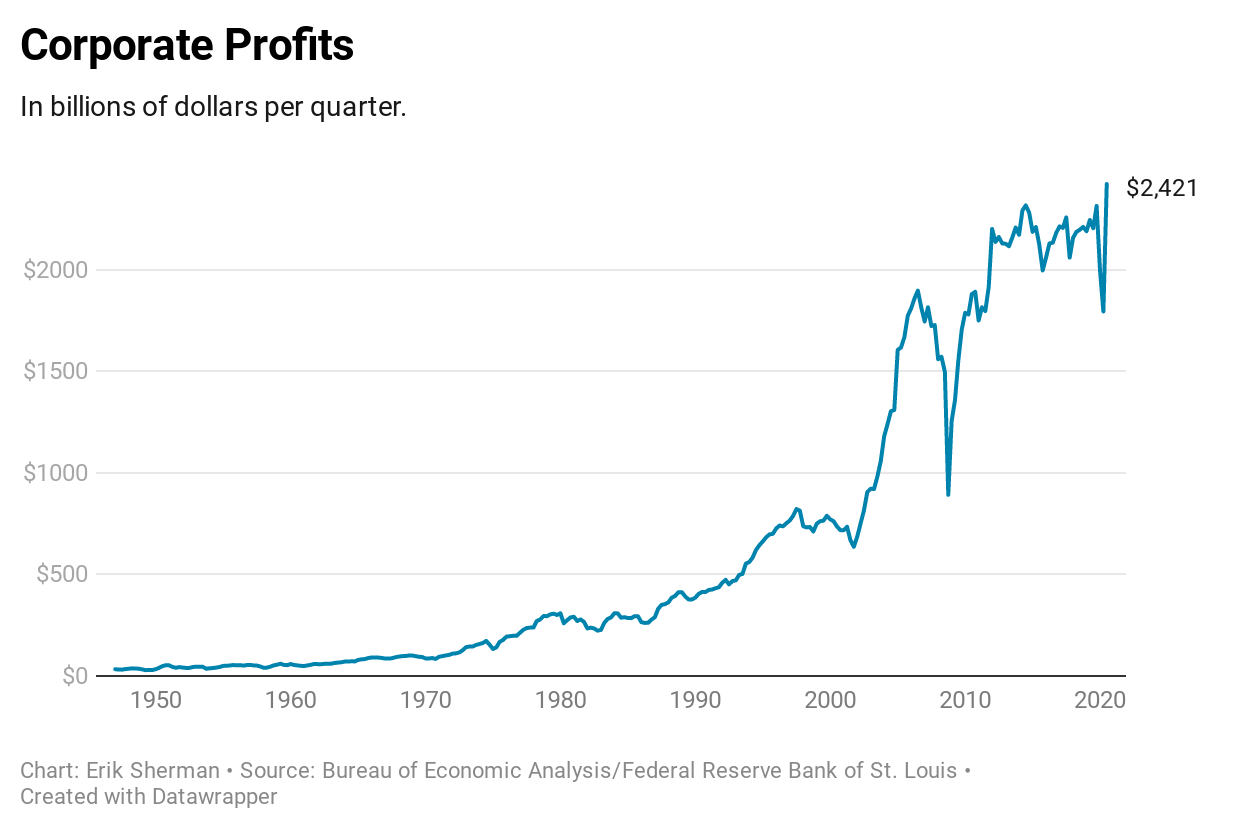
Here is a graph showing pre-tax quarterly corporate profits, with the last point being the third quarter of 2020.
And here is a second graph showing the same data but in constant 1982-1984 dollars to account for inflation.
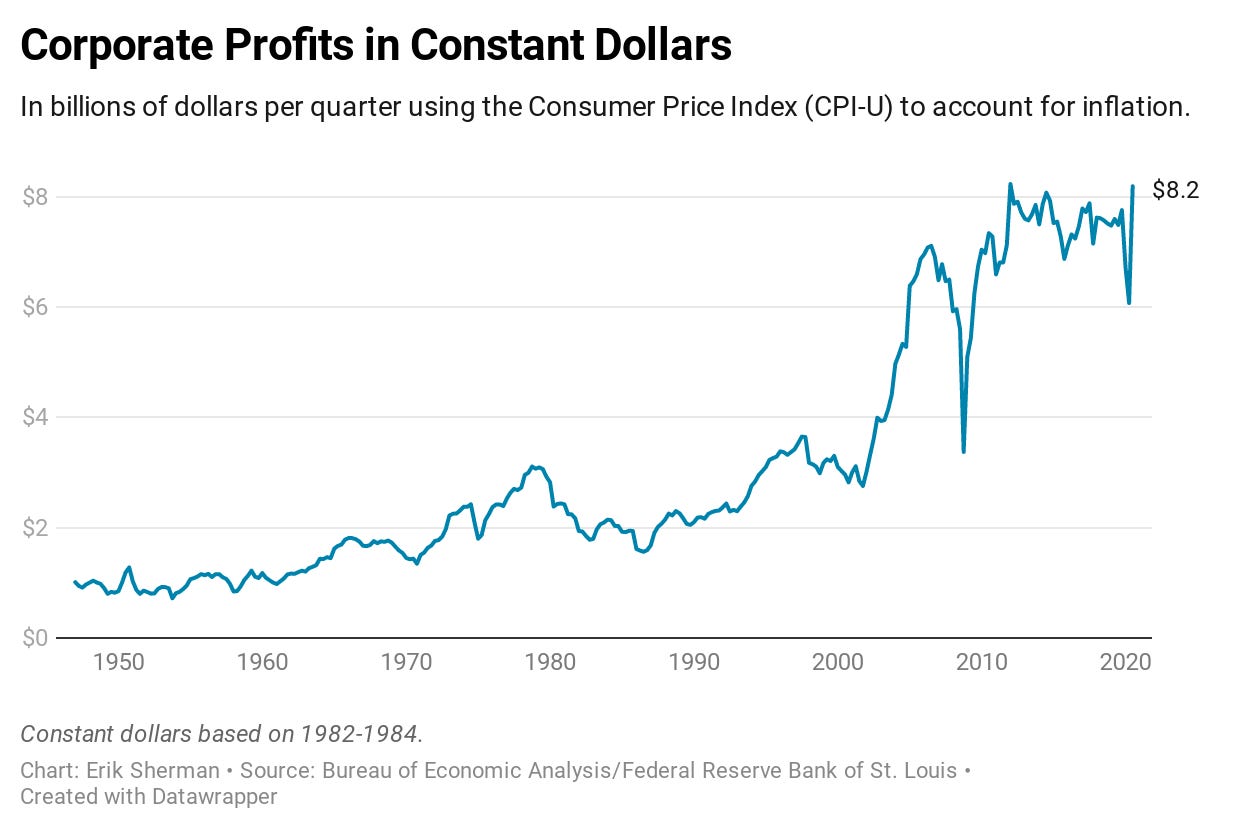
In absolute dollars, pre-tax profits in Q3 2020 were the largest ever recorded. But even in constant dollars, they only dropped to second place behind the first quarter of 2012.
After the pandemic-driven economic disaster, after hundreds of billions pumped into corporations—and not counting Federal Reserve actions providing further loans and bond purchases—companies came out fine. Overall profits had dropped 10.3% in the second quarter but came roaring back 27.1% in the third. Profits last quarter were 3.3% higher than the same period in 2019.
Then there are the federal statistics for ordinary people:
Third quarter personal income decreased by 0.7%.
Quarterly real (after inflation) disposable personal income—what is left after taxes—was down by 0.8%.
Real personal consumption expenditures were up by 0.5%.
Current consumer sentiment for November was largely flat from October, according to University of Michigan data. But the take on the economic outlook fell to its lowest level since August.
Jobless claims rose for the second week in a row. According to Oxford Analytics, “New York and California—representing nearly 20% of national employment—look particularly at risk among large state economies.”
When companies make more before-tax profit is that the gap between what is taken in and what gets spent increases. Was new consumer spending really up that much, or did companies raise prices? Did expenses fall with jobs that were put on hold or cut?
Companies may be doing well, but tens of millions are not. Congress is continuing to do nothing, apparently having to concentrate on getting a budget deal to keep the government from shutting down. In the meantime, the following federal Covid-19 aid will end at the close of the year:
Emergency unemployment insurance (UI) compensation that added 13 weeks of coverage to those who needed it
Pandemic Unemployment Assistance that gig workers and independent contractors used
Eviction moratorium
State and local funding
2020 rebate checks not yet received
Small business debt relief
Exclusion of employer payments toward student loans
Tax credits for self-employed family and sick leave
But corporate profits continue to grind inexorably higher. This shouldn’t be a surprise.
There are the real factors of stopped production and companies working through existing inventory, as Seaton Hall term professor of economics Giacomo Santangelo pointed out to me. Below is a graph showing the size of the swing.
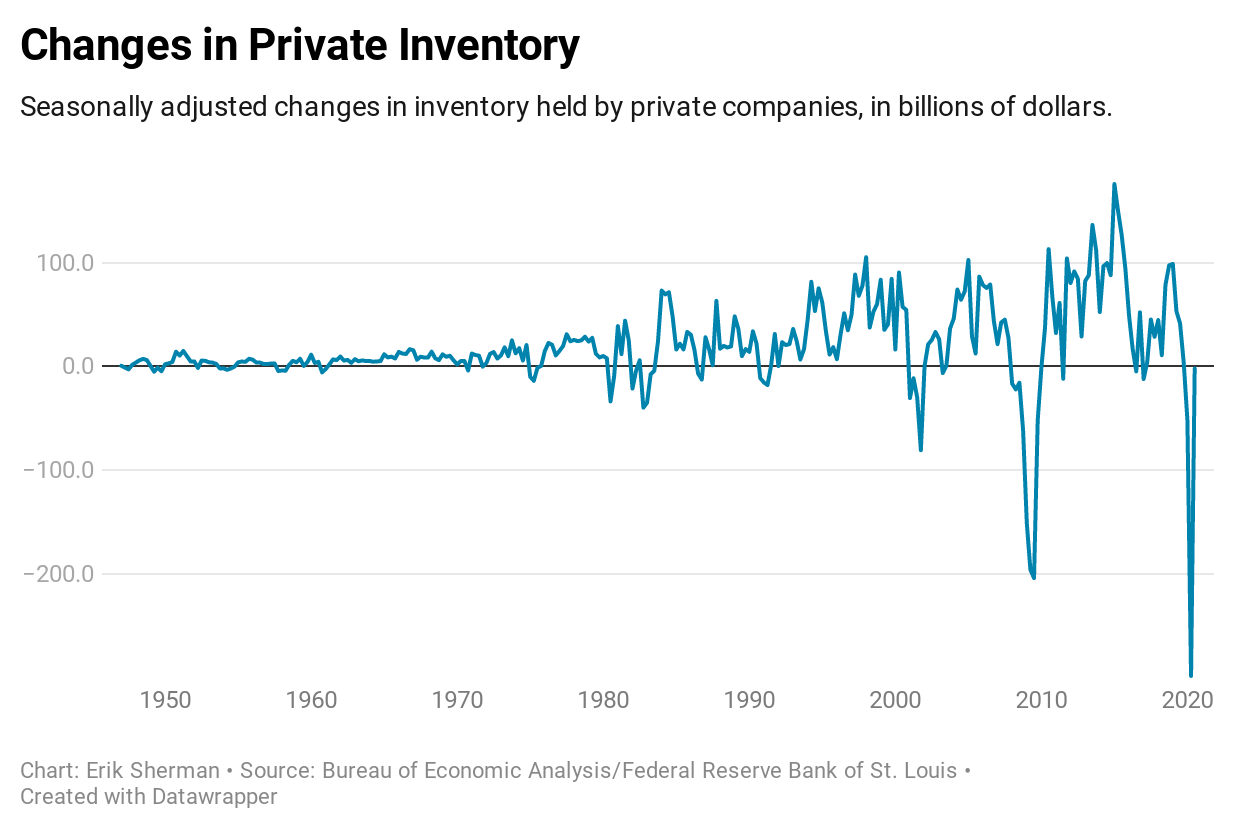
Who needs employees when you’ve got products out in the back?
At the same time, every financial crisis somehow manages to become an additional upward transfer of wealth. At least it isn’t the downward transfer that so many fear from a coming “socialism” that never arrives.
Erik, for the Corporate Profits statistics and charts you have above, what is the group of companies? If it's large or publicly traded companies, I'm not surprised, although there are certainly losers in such a group - e.g. airlines, big hospitality. Much of the pain for business seems like it would be in small, and often privately held, companies such as local retail and small hospitality groups. I wonder if the impact to them is included.